 Der Artikel „Die Superinvestoren von Graham-und-Doddsville“ basiert auf einem Vortrag, den Warren Buffett zur Feier des fünfzigsten Jahrestages von Graham & Dodd’s Geheimnisse der Wertpapieranalyse im Jahr 1984 an der Columbia Universität gehalten hat. In diesem zeichnete er die Leistungen von Investoren nach, die sich dem Value-Ansatz verschrieben haben und damit wohlhabend wurden.
Aus dem Englischen ins Deutsche übersetzt von Die Börsenfrau®.
Ein Nachdruck [1,7 MB PDF-Datei] der Rede erschien im Columbia Buiness School Magazine.
von Warren E. Buffett
Ist es denn überhaupt noch aktuell entsprechend der Lehre Grahams und Dodds „nach Werten mit einer deutlichen Sicherheitsspanne im Verhältnis zu ihrem Preis zu suchen“? An den Universitäten herrscht heutzutage die Lehrmeinung vor, dass die Aktienmärkte effizient wären, also dass die Aktienkurse alle bekannten Aspekte hinsichtlich der Perspektiven eines Unternehmens und der Wirtschaftslage allgemein widerspiegeln. Es gäbe keine unterbewerteten Aktien, so argumentieren diese Theoretiker, denn intelligente Wertpapieranalysten würden alle verfügbaren Informationen nutzen und eine zuverlässige sowie zutreffende Kursprognose garantieren. Diejenigen Investoren, die scheinbar Jahr für Jahr „den Markt schlagen“, hätten eigentlich nur Glück gehabt. „Wenn Aktienkurse alle verfügbaren Informationen vollständig widerspiegeln, ist eine solche Art von Investmentgenie ausgeschlossen“, schreibt einer der modernen Verfechter dieser Theorie.
Nun gut, vielleicht ist es so. Dennoch möchte ich Ihnen einen kleinen Kreis von Investoren vorstellen, die jahrelang den Aktienindex Standard & Poor`s 500 geschlagen haben. Die Hypothese, dass Ihnen dieses nur durch Glück gelang, ist zumindest überprüfenswert. Entscheidend für das Untersuchungsergebnis ist zudem die Tatsache, dass ich diesen kleinen Kreis sehr gut kenne und ich sie bereits vorher schon als Superinvestoren bezeichnet habe – zuletzt vor 15 Jahren. Würde diese Voraussetzung fehlen, also wenn ich erst vor kurzem unter tausenden von Ergebnissen ein paar Namen für Sie heute Morgen ausgesucht hätte, würde ich Ihnen raten, hier mit dem Lesen aufzuhören. Ergänzen möchte ich, dass alle Ergebnisse überprüft wurden. Und noch hinzufügen möchte ich, dass ich viele der Kapitalanleger kenne, die diesen Superinvestoren ihr Geld zur Verwaltung übergeben haben, und wie viel Gewinn sie über die Jahre daraus gezogen haben.
Bevor wir mit der Untersuchung beginnen, möchte ich Sie gerne zu einem Gedankenspiel auffordern. Stellen Sie sich vor, Sie würden an einem nationalen Münzwerf-Wettbewerb teilnehmen. Nehmen wir also an, dass wir morgen früh 225 Millionen Amerikaner dazu bewegen können, um einen Dollar zu wetten. Bei Sonnenaufgang sind alle da und entscheiden sich für eine Seite einer Münze. Wer richtig liegt, bekommt einen Dollar von jenen, die falsch lagen. Dabei scheiden jeden Tag die Verlierer aus und am nächsten Tag stellen sich die Sieger vom Tag zuvor erneut auf. Nach 10 Münzwürfen an 10 Vormittagen sollten in den Vereinigten Staaten rund 220.000 Personen übrig bleiben, die 10 Münzwürfe hintereinander richtig erraten haben. Und jeder hat etwas über 1.000 $ gewonnen.
So wie nun mal die menschliche Natur ist, wird sich diese Gruppe wahrscheinlich ein wenig brüsten. Zwar mögen sie versuchen, bescheiden zu bleiben, aber auf den Cocktailparties werden sie so beiläufig beim anderen Geschlecht etwas über ihre Techniken und großartigen Einsichten auf dem Gebiet des Münzwerfens einstreuen.
Setzen wir nun den Wettbewerb fort und nehmen an, dass die Sieger ihren entsprechenden Preis von den Verlierern erhalten. Nach weiteren 10 Tagen werden wir 215 Personen haben, die die Münzseite nun 20mal hintereinander richtig erraten haben und die damit aus einem Dollar etwas mehr als 1 Million $ gemacht haben. 225 Millionen $ wurden verloren und 225 Millionen $ gewonnen.
Und spätestens jetzt werden jene Sieger verrückt spielen. Eventuell fangen sie an, ein Buch zum Thema „Wie man aus einem Dollar in nur zwanzig Arbeitstagen während dreißig Sekunden je Vormittag eine Million Dollar macht“ zu schreiben Oder vielleicht noch schlimmer: Sie jetten umher und besuchen Seminare zum Thema des effizienten Münzwurfs, streiten sich mit skeptischen Professoren: „Wenn es nicht funktionieren würde, wieso waren wir 215 erfolgreich?“
Spätestens dann werden einige Dozenten aus den Finanzinstituten ein wenig unhöflich einwenden, dass die Ergebnisse so ziemlich die gleichen wären, wenn 225 Millionen Orang-Utans in ein ähnliches Experiment eingebunden wären: Nämlich 215 selbstgefällige Orang-Utans mit 20 Treffern hintereinander.
Allerdings würde ich dagegen halten und einwenden, dass es einen entscheidenden Unterschied gäbe, wenn (a) die aus allen Teilen der US-amerikanischen Population stammenden 225 Millionen Orang-Utans, von (b) denen nach 20 Tagen noch 215 Sieger übrig gebliebenen sind, allein 40 aus einem speziellen Zoo in Omaha stammen. Mit Sicherheit wären alle überzeugt, dass es damit eine bestimmte Bewandtnis auf sich hätte. Man würde eventuell den Tierwärter aufsuchen und fragen, was er ihnen denn zum Fressen geben würde und ob er spezielle Übungen mit ihnen machen würde; welche Bücher sie lesen würden und was sonst noch alles. Das heißt also, dass dort, wo Sie eine wirklich außergewöhnliche Konzentration von Erfolg finden, Sie auch wissen möchten, was die Ursache hierfür sein könnte.
Wissenschaftliche Ansätze folgen normalerweise solchen Mustern. Nehmen wir beispielsweise an, dass Sie die möglichen Ursachen einer seltenen Art von Krebs analysieren wollen – mit, sagen wir, 1.500 Fällen pro Jahr in den Vereinigten Staaten. Nun finden Sie heraus, dass 400 Fälle allein in einer kleinen Bergwerksstadt in Montana auftreten. Sie werden sich nun vermutlich für die dortige Wasserqualität interessieren, oder nach dem ausgeübten Beruf der Betroffenen fragen. Auch andere Variablen werden Sie in Betracht ziehen. Denn eines wissen Sie: Es kann kein Zufall sein, dass gerade 400 Fälle an diesem kleinen Ort vorkommen. Sie müssen dazu nicht unbedingt den ursächlichen Faktor kennen, Sie müssen nur wissen, wo Sie suchen müssen.
Ich behaupte nun, dass man neben der geografischen Herkunft auch eine andere Herkunft definieren kann. Ich möchte dies als intellektuelle Herkunft bezeichnen. So meine ich, dass Sie eine unverhältnismäßig große Anzahl von erfolgreichen Münzwerfern in der Investmentwelt finden werden, die aus einem sehr kleinen intellektuellen Dorf, das man Graham-und-Doddsville nennen könnte, stammen.
Andere Voraussetzungen könnten jedoch eine derartige Konzentration unwichtig erscheinen lassen. Nehmen wir einmal 100 Personen, die dem Münzwurf einer ausgesprochen überzeugenden Persönlichkeit folgen und jeden Ausruf dabei imitieren. Ruft sie Kopf, dann rufen alle 100 automatisch auch Kopf. Wenn diese Persönlichkeit Teil der 215 Übriggebliebenen war, bedeutet die Tatsache, dass 100 den gleichen intellektuellen Ursprung haben, überhaupt nichts. Man würde sie einfach als eine von hundert Fällen definieren. Lassen Sie uns auf die gleiche Weise annehmen, dass wir in einer streng patriarchalischen Gesellschaft leben und jede Familie in den Vereinigten Staaten würde zur Vereinfachung aus 10 Mitgliedern bestehen. Lassen Sie uns weiter annehmen, dass die patriarchalische Kultur so ausgeprägt ist, dass jedes Familienmitglied aller 225 Millionen Personen vom ersten Tag an sich mit dem Münzruf des Vaters identifiziert. Am Ende der Zwanzig-Tagesperiode würde man wieder 215 Gewinner haben, die wie Sie richtig sehen, nur aus 21,5 Familien stammen. Ein paar naive Menschen werden als Erklärung für das erfolgreiche Münzwerfen dafür erbliche Faktoren verantwortlich machen. Aber es hätte natürlich überhaupt keine Beweiskraft, denn es würde einfach nur bedeuten, dass es nicht 215 individuelle Sieger gäbe, sondern vielmehr 21,5 zufällige Familien, die die Sieger wären.
In jener Gruppe erfolgreicher Investoren, von denen ich spreche, gibt es auch einen gemeinsamen intellektuellen Patriarchen, nämlich Benjamin Graham. Allerdings haben die Kinder, nachdem sie das Haus dieses intellektuellen Patriarchen verlassen haben, ihre „Münzen“ ganz unterschiedlich geworfen. Sie wohnen nicht zusammen an gleichen Plätzen und haben weder gleiche Aktien noch gleiche Unternehmen gekauft oder verkauft. Doch sie weisen eine gemeinsame Leistung auf, die nicht einfach durch die Tatsache erklärt werden kann, dass sie alle die gleiche Münzseite benannt haben, nur weil jemand ihnen diese Münzseite signalisiert hat. Der Patriarch hat allein die intellektuelle Lehre zur Münzbestimmung weitergegeben. Jeder Student hat in seiner eigenen Art und Weise entschieden, wie er diese Lehre anwendet.
Der gemeinsame intellektuelle rote Faden der Investoren von Graham-und-Doddsville sieht wie folgt aus: Sie suchen nach einer Abweichung im Unternehmenswert vom Preis eines am Aktienmarkt gehandelten kleinen Anteils dieses Unternehmens. Im Wesentlichen nutzen sie solche Abweichungen, ohne die Theorie der effizienten Märkte im Hinblick auf den Kauf am Montag oder Dienstag zu berücksichtigen. Oder im Hinblick darauf, ob es Januar oder Juli, usw. ist. Schauen Sie sich an, wie Geschäftsleute verfahren. Wenn Geschäftsleute Unternehmen kaufen, und das ist genau das, was unsere Investoren von Graham & Dodd mit dem Kauf von börsennotierten Aktien machen, dann bezweifle ich, dass viele sich bei ihrer Kaufentscheidung vom Wochentag oder Monat, an dem die Transaktion stattfindet, verrückt machen lassen. Und da es keinen Unterschied macht, ob man ein gesamtes Unternehmen an einem Montag oder Freitag kauft, erstaunt es mich immer wieder, weshalb Akademiker so viel Zeit und Mühe darauf verwenden, um zu sehen, ob es einen Unterschied macht, wenn man kleine Anteile am selben Unternehmen an einem bestimmten Wochentag oder Monat kauft. Unsere Investoren von Graham & Dodd diskutieren nie über Beta, das Capital Asset Pricing Modell oder die Kovarianz der Rentabilität bei Wertpapieren. Das interessiert sie einfach nicht. Wahrscheinlich würden viele von ihnen eher Schwierigkeiten mit der Terminologie haben. Diese Investoren konzentrieren sich ganz einfach auf zwei Variablen: Preis und Wert.
Ich finde es immer wieder faszinierend, dass so viele Studien über das Verhalten von Kurs und Volumina, der Stoff der Chartisten, gemacht werden. Können Sie sich vorstellen, dass Sie ein ganzes Unternehmen einfach kaufen, nur weil der Preis des Unternehmens sich letzte Woche und die Woche zuvor deutlich nach oben bewegt hat? Natürlich liegt einer der Gründe darin, dass heute im Computerzeitalter, wo eine schier endlose Datenmenge zur Verfügung steht, eine Menge von Studien über Kurs- und Volumenvariablen gemacht werden. Sie werden nicht unbedingt gemacht, weil sie eventuell einen Nutzen hätten; sie werden einfach gemacht, weil es die Daten gibt und Akademiker hart die dafür notwendigen mathematischen Fähigkeiten erlernt haben, um diese Daten zu manipulieren. Nachdem man sich nun diese Fähigkeiten angeeignet hat, scheint es einem Sündenfall gleich zu kommen, sie nicht anzuwenden. Auch wenn der Gebrauch keinerlei Nutzen verspricht. So wie einer meiner Freunde meinte: „Für einen Mann mit einem Hammer sieht alles wie ein Nagel aus.“
Nun denke ich, dass es sich lohnt, die Gruppe, die aus einem gemeinsamen intellektuellen Haus stammt, einmal genauer zu betrachten. Nur nebenbei bemerkt, es gibt trotz aller akademischer Studien über den Einfluss von Variablen wie Preis, Volumen, Saisonalität, Kapitalisierungsgröße, u.a. auf die Aktienperformance offensichtlich kein Interesse am Studium der Methoden dieser ungewöhnlichen Konzentration von wertorientierten Siegern.
Lassen Sie mich zur Beurteilung der Ergebnisse auf unsere Gruppe bestehend aus vier Personen, die von 1954 bis 1956 bei Graham-Newman Corporation arbeiteten, zurückgreifen. Es gab nur uns vier – ich habe also diese Namen nicht aus tausenden von Namen ausgewählt. Nachdem ich Vorlesungen von Ben Graham besucht habe, bot ich ihm an, bei Graham-Newman praktisch kostenlos zu arbeiten. Er lehnte mich allerdings als zu teuer ab. Er nahm dieses Value-Zeug sehr ernst! Nachdem ich ihm aber lange genug in den Ohren gelegen habe, stellte er mich schließlich doch ein. Die Firma bestand aus drei Teilhabern und uns vier Banausen. Und alle vier verabschiedeten wir uns zwischen 1955 und 1957, als die Firma aufgelöst wurde. Die Leistungen dieser Banausen möchte ich Ihnen nun zeigen.
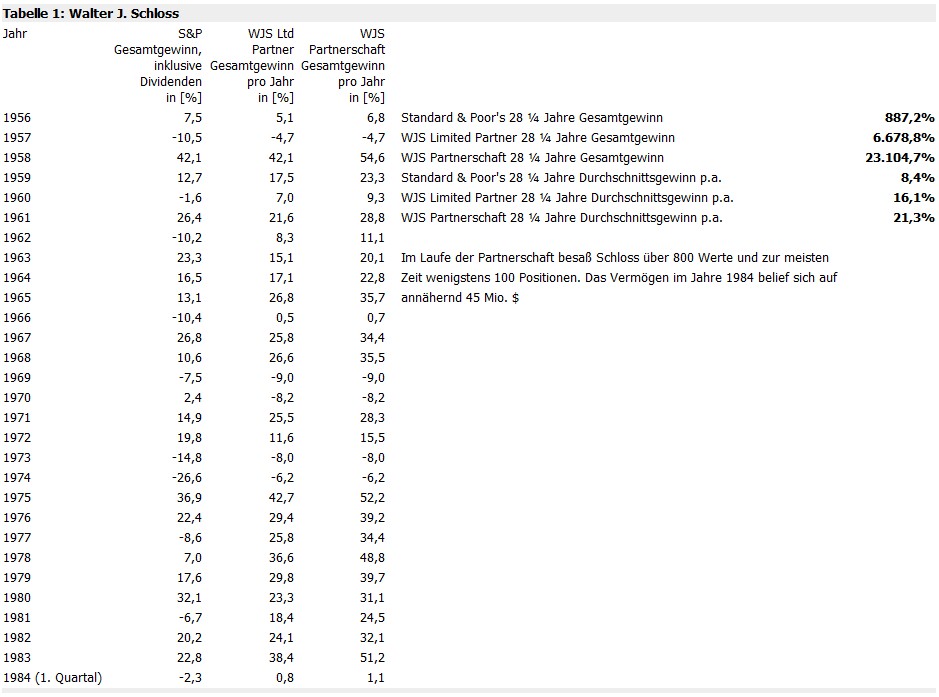
Als erstes nehmen wir Walter Schloss (siehe Tabelle 1). Walter hatte nie ein College besucht. Nur abends besuchte er die Kurse von Ben Graham am New Yorker Institute of Finance. Walter verließ Graham-Newman 1955 und über einen Zeitraum von 28 Jahren erzielte er die hier aufgezeigten Leistungen. So schrieb „Adam Smith“ – nachdem ich ihm von Walter erzählt habe – in Supermoney (1972) über ihn:
Er hat keine Beziehungen oder sonstigen Zugang zu besonders nützlichen Informationen. An der Wall Street kennt ihn praktisch niemand und er ist nicht mit irgendwelchen Ideen vollgestopft. Er prüft einfach die Zahlen in den Handbüchern und lässt sich die Jahresberichte zukommen. Und das war’s.
Als ich Schloss vorgestellt wurde, beschrieb Warren ihn so: „Er vergisst nie, dass er das Geld anderer Leute verwaltet. Und das verstärkt seine schon normalerweise große Abneigung gegen Verluste“ Er ist vollkommen integer und hat eine realistische Einschätzung von sich selbst. Geld, wie auch Aktien, ist für ihn etwas Reales – und deshalb fühlt er sich zum Prinzip der Sicherheitsmarge hingezogen.
Walter Schloss
(zum Vergrößern Grafik anklicken)
Walter diversifizierte in hohem Maße und hatte stets weit über 100 Aktien im Portfolio. Er besitzt die Fähigkeit, Wertpapiere herauszufiltern, deren Preis wesentlich unter dem tatsächlichen Wert liegt. Und das ist alles, was er macht. Er macht sich keine Gedanken darüber, ob es Januar ist; er macht sich keine Gedanken darüber, ob es Montag ist und er macht sich keine Gedanken darüber, ob es ein Wahljahr ist. Er meint ganz einfach: Wenn ein Unternehmen einen Dollar wert ist und ich es für 40 Cent kaufen kann, dann ist das gut für mich. Und so verfährt er immer wieder. Er besitzt mehr Aktien als ich – und er ist weit weniger am Geschäftsmodell interessiert als ich, da scheine ich nicht gerade viel Einfluss auf Walter zu haben. Aber das ist eine seiner Stärken; niemand kann ihn beeinflussen.
Der zweite Fall ist Tom Knapp, der auch mit mir bei Graham-Newman arbeitete. Tom war vor dem Krieg Chemiker in Princeton. Als er aus dem Krieg zurückkam, bummelte er nur noch am Strand herum. Und dann las er eines Tages, dass Dave Dodd einen Abendkurs über Kapitalanlagen an der Columbia gab. Tom besuchte einen Kurs und begann sich so stark für das Thema zu interessieren, dass er sich schließlich an der Columbia Business School einschrieb, die er später mit einem MBA abschloss. Er besuchte die Kurse von Dodd und Graham. Nebenbei möchte ich noch bemerken, dass ich Tom 35 Jahre später angerufen habe, um einige Fakten zu ermitteln. Ich habe ihn wieder am Strand vorgefunden. Allerdings mit dem Unterschied, dass er nun den Strand sein eigen nennen konnte.
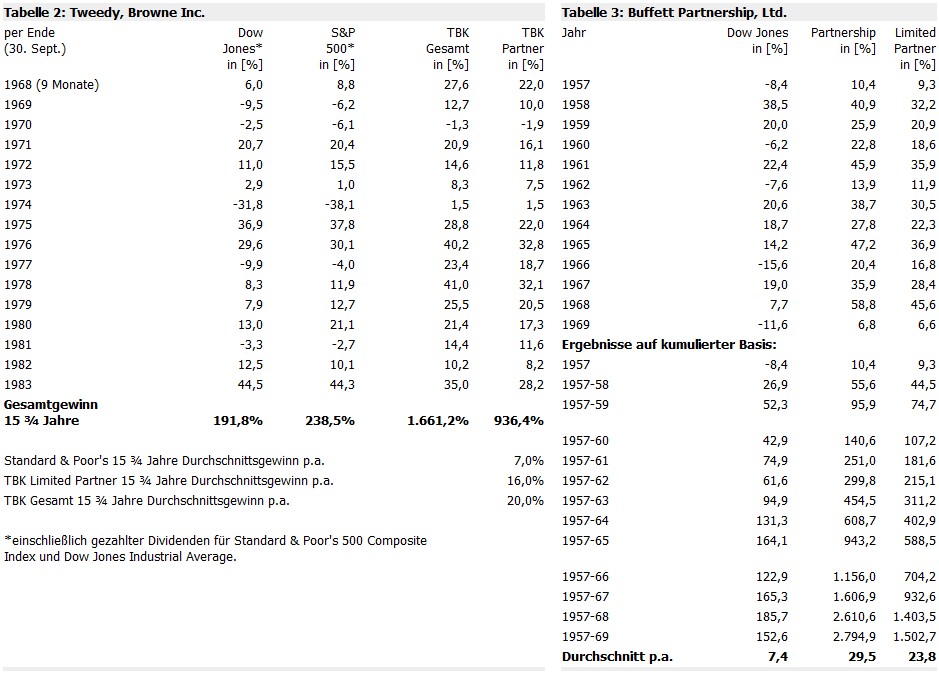
1968 gründeten Tom Knapp und Ed Anderson, ebenfalls ein Graham-Anhänger, zusammen mit einem oder zwei anderen Partnern, die eine ähnliche Denkensart pflegten, Tweedy, Browne Partners. Die Ergebnisse ihrer Kapitalanlagen stehen in Tabelle 2. Tweedy, Browne haben diese Resultate erzielt, indem sie ihre Kapitalanlagen sehr breit diversifizierten. Hin und wieder haben sie die Kontrolle eines Unternehmens übernommen, doch ist kein Unterschied in den Ergebnissen zwischen den passiven Kapitalanlagen und denjenigen der von ihnen kontrollierten Unternehmen zu erkennen.
Tabelle 3 zeigt die Ergebnisse des dritten Mitglieds der Gruppe. Dieses Mitglied gründete 1957 die Buffett Partnership und verließ sie 1969. Das war das Beste. In gewisser Weise ist seit damals Berkshire Hathaway sozusagen die Weiterführung der Beteiligungsgesellschaft (Anm. Übers.: Buffett Partnership). Zu Berkshire gibt es keinen einzigen Index, den ich Ihnen als Bezugswert empfehlen kann. Doch ich denke, dass Sie selbst erkennen können, wie zufrieden stellend die Ergebnisse sind.
Tweedy, Browne und Buffett Partnership
(zum Vergrößern Grafik anklicken)
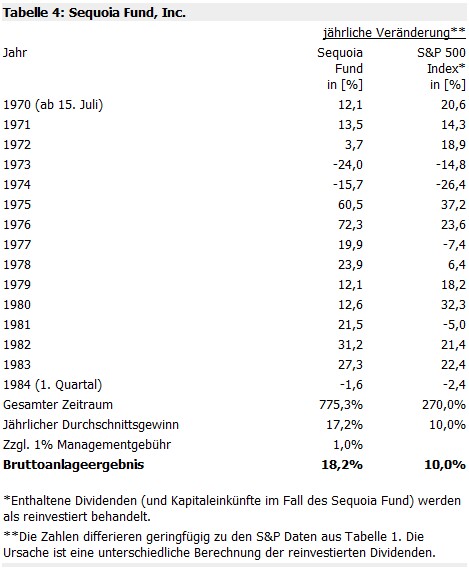
Tabelle 4 zeigt die Ergebnisse des Sequoia Fund, der von Bill Ruane verwaltet wird, den ich 1951 in Ben Grahams Kurs kennen lernte. Nachdem Bill die Harvard Business School beendet hatte, ging er an die Wall Street. Doch dann stellte sich heraus, dass für ihn eine betriebswirtschaftliche Ausbildung besser wäre. So entschloss er sich, einen Kurs an der Columbia, wo wir uns Anfang 1951 trafen, zu besuchen. Als ich die Buffett Partnership auflöste, fragte ich Bill, ob er einen Fonds aufbauen würde, um alle unsere Gesellschafter zu bedienen. Und so baute er den Sequoia Fund auf. Er begann in einer ausgesprochen schwierigen Zeit, also in einer Zeit, in der ich gerade die Partnership verließ. Er geriet direkt in einen turbulenten Markt und damit in alle Schwierigkeiten, die für eine Vergleichsperformance für wertorientierte Anleger wie gemacht sind. Ich freue mich, Ihnen sagen zu können, dass meine Partner ihm nicht nur treu blieben, sondern – wie Sie sehen können – Kapital in einem wunderbaren Ausmaß anhäuften.
Bill Ruane (Sequoia Fund)
(zum Vergrößern Grafik anklicken)
Wir reden hier nicht von hinterher. Bill war damals der Einzige, den ich meinen Gesellschaftern empfohlen habe und ich sagte noch, dass wenn er auch nur 4 Prozentpunkte mehr als der Standard & Poor’s erzielen könnte, er eine grundsolide Performance aufweisen könnte. Bill erreichte weit mehr und arbeitete mit ständig größer werdenden Summen. Was alles noch viel schwieriger machte, denn Größe hängt mit der Performance zusammen. Damit möchte ich aber nicht sagen, dass man aufgrund der immer größer werdenden Summen keine besseren Resultate als der Durchschnitt erzielen kann. Doch die Margen werden kleiner. Und wenn Sie jemals zwei Billionen Dollar verwalten sollten, und es wäre zufällig das gesamte Wirtschaftskapital, dann glauben Sie nur nicht, dass Sie besser als der Durchschnitt sein werden.
Ich sollte hinzufügen, dass praktisch bei den bisher betrachteten Leistungsausweisen über den gesamten Zeitraum hinweg kein Portfolio dem anderen glich. Die Wertpapiere wurden in Hinblick auf die Differenz zwischen Preis und tatsächlichem Wert ausgewählt, aber jeder traf die Auswahl nach sehr unterschiedlichen Gesichtspunkten. Walters größte Beteiligungen waren so solide wie Hudson Pulp & Paper und Jeddo Highland Coal und New York Trap Rock Company und all jene Namen, die auch einem gelegentlichen Leser der Finanzseiten in den Kopf schießen. Tweedy Brownes Auswahl steht dem nur wenig nach. Bill andererseits bevorzugte große Unternehmen. Die Portfolios überschnitten sich nur sehr wenig. Die Leistungen sind also nicht zustande gekommen, weil einer mit dem Finger geschnipst hat und fünfzig andere nacheiferten.
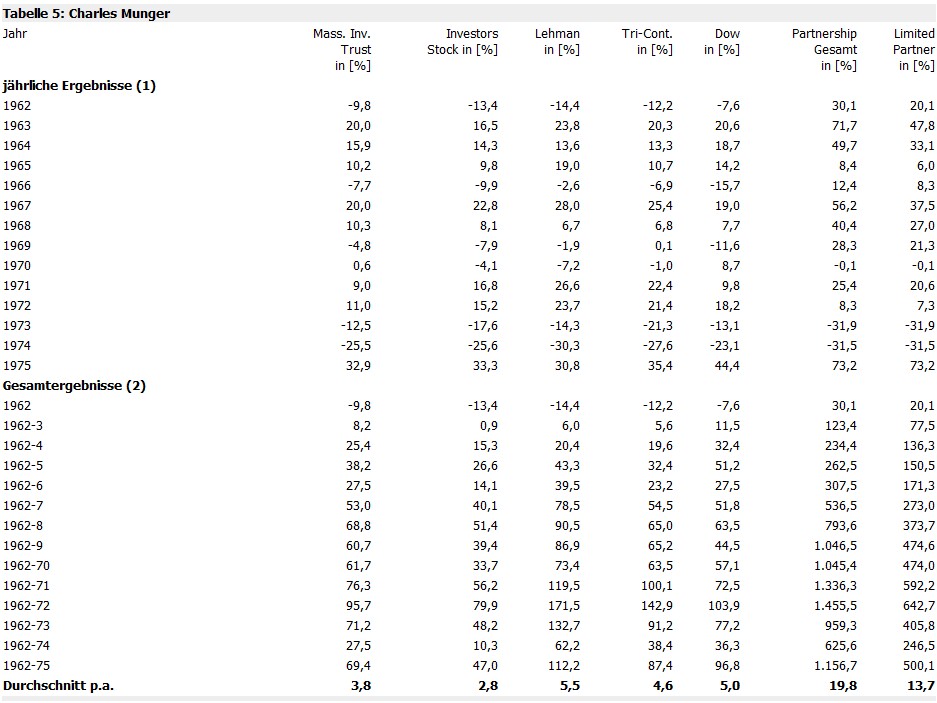
Tabelle 5 zeigt die Ergebnisse eines meiner Freunde, der in der Rechtswissenschaft in Harvard einen akademischen Grad erlangte und eine große Anwaltskanzlei aufbaute. Ich traf ihn zufällig um 1960 und meinte ihm gegenüber, dass Recht als Hobby gut wäre, aber es gäbe etwas Besseres für ihn. So gründete er eine Beteiligungsgesellschaft, die völlig anders als Walters war. Sein Portfolio konzentrierte sich auf wenige Wertpapiere. Und so waren seine Ergebnisse auch unbeständiger. Doch er war bereit, ausgeprägte Hochs und Tiefs in der Performance zu akzeptieren. Er war jemand, dessen gesamter Charakter nach Konzentration verlangte, so wie die aufgezeigten Ergebnisse. Übrigens gehören diese Ergebnisse zu Charlie Munger, meinem langjährigen Partner bei Berkshire Hathaway. Die Beteiligungen seines damaligen Portfolios unterschieden sich fast gänzlich von meinen und denen der anderen bereits erwähnten Kollegen.
Charles Thomas Munger
(zum Vergrößern Grafik anklicken)
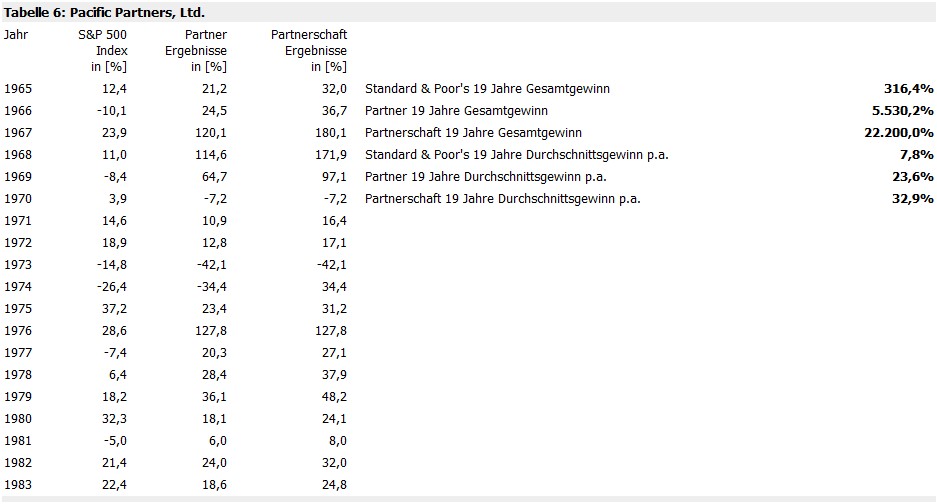
Tabelle 6 zeigt die Ergebnisse eines Kollegen, ein Freund von Charlie Munger. Auch er war kein Business School-Typ. Er war führender Mathematiker in USC. Nach der Graduierung ging er zu IBM und arbeitete dort einige Zeit als Vertriebsmann. Charlie hat ihn nach unserer eigenen Zusammenkunft getroffen. Es sind die Ergebnisse von Rick Guerin. Rick erzielte von 1965 bis 1983 eine Gesamtrendite von 22.200% – die Gesamtrendite des S&P betrug im Vergleich dazu 316%. Was wahrscheinlich darauf zurückzuführen ist, dass er keine Ausbildung an einer Business School genoss, auch wenn er sie als wichtig ansieht.
Rick Guerin (Pacific Partners)
(zum Vergrößern Grafik anklicken)
Etwas möchte ich hier noch kurz einwerfen: Mich verblüfft es immer wieder, wie der Ansatz, einen Dollar für 40 Cent zu kaufen, Leute entweder sofort anspricht oder nie. Als würde man geimpft werden: Wer nicht sofort darauf anspricht, der spricht auch nach meiner Erfahrung dann nicht darauf an, auch wenn Sie jahrelang auf ihn einreden und ihm immer wieder die Ergebnisse aufzeigen. Solche Leute scheinen einfach nicht fähig zu sein, das Konzept zu begreifen, so einfach es auch ist. Jemand wie Rick Guerin, der keine formelle Ausbildung in Betriebswirtschaft hat, versteht den Wertansatz der Anlage sofort und wendet ihn fünf Minuten später an. Ich habe nie jemanden kennen gelernt, der sich über eine Zeit von 10 Jahren dieser Methode allmählich angenähert hätte. Es scheint keine Sache eines IQs oder einer akademischen Ausbildung zu sein. Entweder schlägt es wie ein Blitz ein oder nicht.
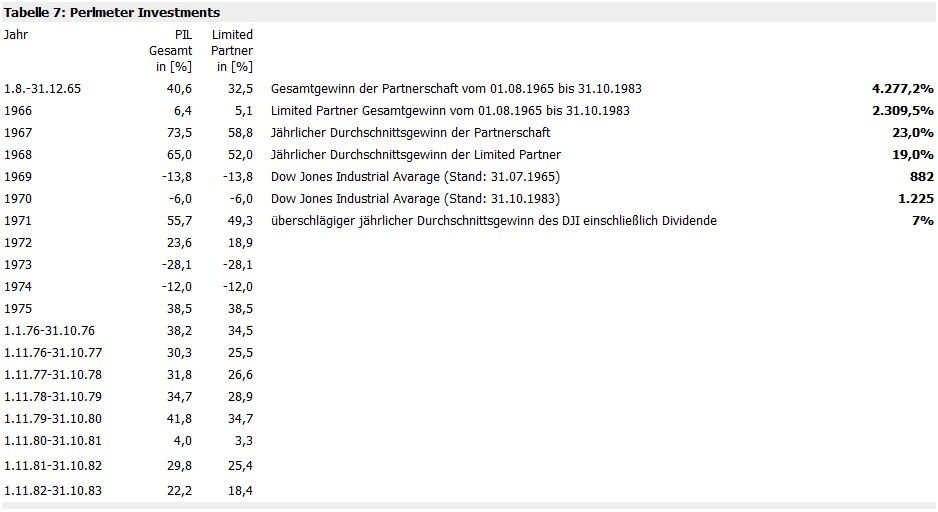
Tabelle 7 zeigt die Ergebnisse von Stan Perlmeter. Stan war Kunstwissenschaftler an der Universität von Michigan. Er war Partner der Werbeagentur von Bozell & Jacobs. Wir saßen zufällig im gleichen Gebäude von Omaha. 1965 rechnete er sich aus, dass ich ein besseres Geschäft hatte als er. So verließ er das Werbegeschäft. Und wieder brauchte es nur fünf Minuten für Stan, um den Wertansatz zu verstehen.
Stan Perlmeter
(zum Vergrößern Grafik anklicken)
Perlmeter hat im Portfolio nicht, was Walter Schloss im Portfolio hat. Er hat im Portfolio nicht, was Bill Ruane in seinem hat. Es sind Ergebnisse, die völlig unabhängig von einander erbracht wurden. Doch jedes Mal, wenn Perlmeter eine Aktie kauft, dann deshalb, weil er mehr für sein Geld bekommt als er zahlen muss. Das ist das einzige, woran er denkt. Er beachtet keine Vierteljahresprognosen, keine zukünftigen Jahresgewinne und er denkt nicht darüber nach, welcher Wochentag gerade ist. Er kümmert sich nicht darum, was welcher Investment Research von wo auch immer empfiehlt. Er ist weder an Kursmomentum, Volumen oder sonst was interessiert. Er fragt sich einfach nur: Was ist dieses Unternehmen wert?
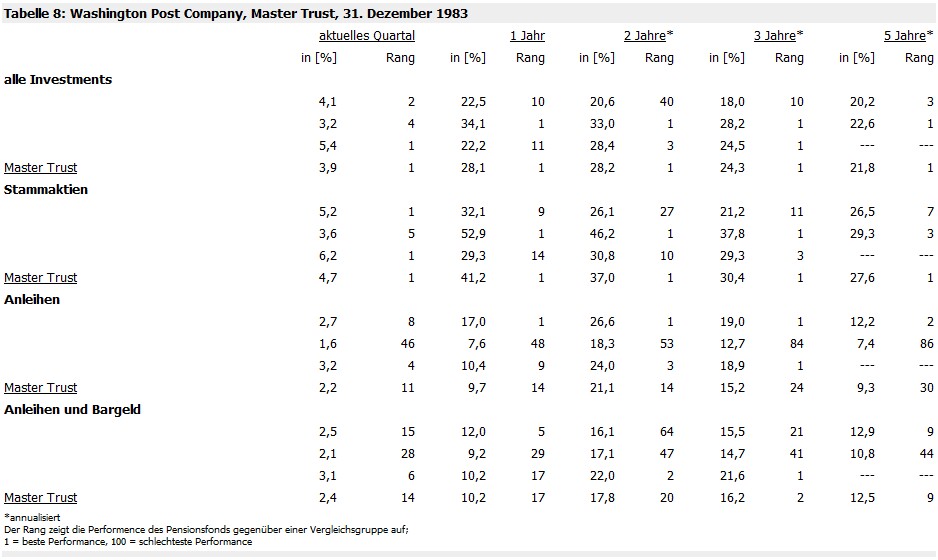
Tabelle 8 und Tabelle 9 sind die Ergebnisse zweier Pensionsfonds, in denen ich involviert gewesen bin. Dabei handelt es sich nicht um zwei aus einem Dutzend ausgewählter Pensionsfonds, die ich beraten habe. Nein, ich habe nur diese beiden beraten. Und in beiden Fällen habe ich empfohlen, für das Management wertorientierte Manager zu verpflichten. Nur sehr sehr wenige Pensionsfonds werden aus Sicht des wertorientierten Anlegens verwaltet. Tabelle 8 zeigt den Pensionsfonds der Washington Post. Zusammen mit einer großen Bank schlug ich vor einigen Jahren vor für die Fondsverwaltung Manager auszuwählen, die sich am Wertansatz orientieren.
Master Trust (Washington Post Company)
(zum Vergrößern Grafik anklicken)
Wie Sie sehen, bewegen sich die Ergebnisse seit dem Wechsel der Manager im oberen Prozentbereich. Die Post gab den Fondsverwaltern zwar die Vorgabe, mindestens 25% des Fondskapitals in Bonds anzulegen, was nicht unbedingt die Entscheidung dieser Manager gewesen wäre. Dennoch habe ich die Rendite aus den Bond-Anlagen mit eingerechnet, nur um zu zeigen, dass diese Gruppe über keine besonderen Fachkenntnisse zu Bondanlagen verfügt. Sie selbst würden dies auch nicht behaupten. Aber auch mit diesem Bremsklotz von 25% des Fondskapitals in einem Bereich, das nicht ihre Spielwiese war, erzielten sie Renditen im oberen Prozentbereich, wie die Reihe jener anderen Fondsmanager. Die Erfahrungswerte der Washington Post umfassen keine sehr lange Zeitspanne, aber sie repräsentieren eine Vielzahl von Anlageentscheidungen der drei Manager. Und schauen Sie, die drei habe ich nicht erst im Nachhinein aus einer Reihe von Managern ausgewählt.
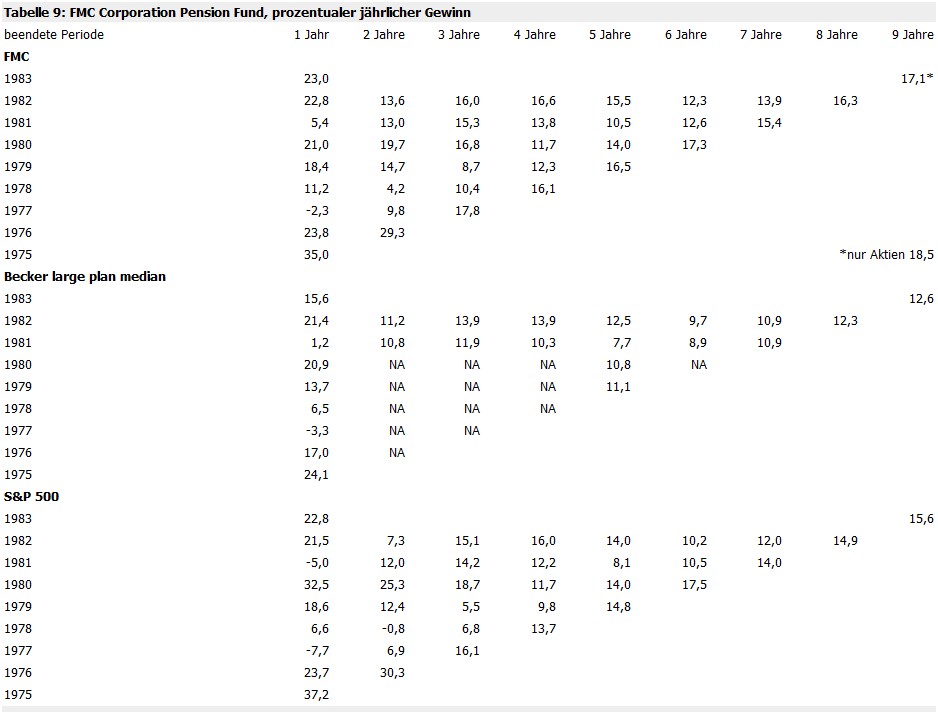
Tabelle 9 zeigt die Ergebnisse des Fonds der FMC Corporation. Ich verwaltete nicht einen Groschen davon selbst, aber 1974 konnte ich so entscheidend darauf einwirken, dass wertorientierte Manager für die Fondsverwaltung eingesetzt wurden. Die zuvor tätigen Geldmanager wurden in der gleichen Art und Weise wie in den meisten großen Unternehmen ausgesucht. Heute wird der Fonds als Nummer 1 im Becker Survey der Pensionsfonds gelistet, und zwar für die Größe, die er im Laufe der Zeit infolge der „Umwandlung“ zum Wertansatz hin erreichte. Im letzten Jahr standen acht Aktienmanager mit einer Dauer von mehr als einem Jahr unter Vertrag. Sieben von ihnen erzielten eine bessere Gesamtleistung als der S&P. Die aktuelle Nettodifferenz zwischen einer durchschnittlichen Performance und der tatsächlichen Performance des FMC Fonds innerhalb dieses Zeitraums beläuft sich auf 243 Millionen Dollar. FMC schreibt dies der geistigen Haltung zu, die sie nun bei der Auswahl der Fondsverwaltung pflegen. Jene Manager sind nicht notwendigerweise Manager, die ich auswählen würde, aber sie besitzen einen gemeinsamen Nenner bei der Auswahl von Wertpapieren, der auf dem Wertansatz basiert.
FMC Corporation Pension Fund
(zum Vergrößern Grafik anklicken)
So sehen die neun Ergebnisse der „Münzwerfer“ aus Graham-und-Doddsville aus. Ich habe sie nicht im Nachhinein untern tausenden ausgewählt. Und ich trage Ihnen auch nicht die Namen aus einer Gruppe von Lotteriegewinnern vor – Leute, von denen ich vor dem Lotteriegewinn niemals gehört habe. Nein, ich habe diese Personen schon vor Jahren aufgrund ihrer Vorgehensweise bei den Anlageentscheidungen ausgesucht. Mir war bekannt, was ihnen gelehrt wurde und zudem kenne ich ein wenig ihren Intellekt, Charakter und ihr Temperament. Es ist vor allem wichtig, dass Sie verstehen, dass diese Gruppe weit weniger Risiko als der Durchschnitt eingeht. Beachten Sie besonders deren Ergebnisse bei einer allgemein schwachen Börsenlage. Zwar unterscheiden sich diese Manager vom Stil her sehr stark voneinander, aber sie kaufen immer Unternehmen und nicht Aktien. Einige von ihnen kaufen manchmal auch ganze Unternehmen. Doch weitaus häufiger kaufen sie kleine Firmenanteile. Doch gleichgültig ob sie das gesamte Unternehmen oder nur kleine Teile davon kaufen, der Standpunkt bleibt derselbe. Einige von ihnen halten Portfolios mit Dutzenden von Aktien; andere konzentrieren sich auf nur eine Handvoll Aktien. Aber alle nutzen den Unterschied zwischen dem Marktpreis des Unternehmens und dem inneren Wert.
Ich bin überzeugt, dass es viel Ineffizienz in den Aktienmärkten gibt. Und jene Investoren aus Graham-und-Doddsville haben erfolgreich den Unterschied von Preis und Wert genutzt. Wenn an der Wall Street der Aktienkurs, der von den emotionalsten oder den gierigsten oder den mutlosesten Menschen bestimmt wird, durch eine „Herde“ beeinflusst werden kann, darf kaum jemand damit argumentieren, dass am Markt die Kurse immer rational festgestellt werden. Tatsächlich sind die Börsenkurse häufig unsinnig.
Ich möchte noch etwas Wichtiges über Risiko und Chance sagen. Manchmal korrelieren Risiko und Chance positiv miteinander. Nehmen wir an, jemand würde mir vorschlagen: „Ich habe hier einen Sechstrommelrevolver und eine Patrone eingelegt. Sichern Sie ihn und drücken Sie einmal ab. Wenn Sie überleben, bekommen Sie eine Million Dollar.“ Ich würde ablehnen, denn eine Million Dollar wäre mir nicht genug. Vielleicht bietet man mir dann fünf Millionen Dollar an, wenn ich den Auslöser zweimal drücke. Somit würden nun Risiko und Chance positiv korrelieren!
Beim wertorientierten Anlegen trifft das genaue Gegenteil zu. Wenn Sie einen Dollar für 60 Cent kaufen, ist es riskanter als wenn Sie einen Dollar für 40 Cent kaufen, doch die Aussicht auf die Vergütung ist im letzten Fall größer. Je höher das Chancen-Potential in einem Value-Portfolio ist, desto geringer ist das Risiko.
Ein kurzes Beispiel: 1973 wurde die Washington Post Company für 80 Millionen Dollar am Markt gehandelt. Gleichzeitig hätten Sie am gleichen Tag das Anlagevermögen einem von 10 Käufern für nicht weniger als 400 Millionen Dollar, wahrscheinlich aber deutlich mehr, verkaufen können. Die Gesellschaft besaß die Post, Newsweek sowie mehrere Fernsehstationen in Schlüsselmärkten. Dieselben Liegenschaften sind heute 2 Milliarden Dollar wert. So wäre jemand, der 400 Millionen Dollar gezahlt hätte, sicher nicht verrückt gewesen.
Nun würde das Beta, wenn der Aktienkurs noch weiter fällt bis zu einem Kurs, der die Bewertung auf 40 Millionen Dollar statt 80 Millionen Dollar bringen würde, damit aber noch höher. Und für Leute, die glauben, dass Beta das Risiko misst, würde der günstige Preis noch riskanter aussehen. Da befinden wir uns wirklich in Alices Wunderland. Ich habe es nie verstanden, warum es riskanter sein soll, wenn man Besitz im Wert von 400 Millionen Dollar für 40 Millionen Dollar statt für 80 Millionen Dollar kauft. Und so besteht in der Tat, wenn Sie eine Reihe solcher Wertpapiere kaufen und Sie sich in der Unternehmensbewertung auskennen, praktisch kein Risiko, wenn Sie 400 Millionen Dollar für 80 Millionen Dollar kaufen. Vor allem wenn Sie dabei so vorgehen und jeweils zehn 40-Millionen-Dollar-Pakete à 8 Millionen kaufen. Außerdem möchten Sie sich mit ehrlichen und kompetenten Leuten umgeben, da Sie keinen Einfluss auf die 400 Millionen Dollar haben. Doch das dürfte nicht so schwierig sein.
Weiter müssen Sie Kenntnisse besitzen, die Sie befähigen, den Wert des entsprechenden Unternehmens ganz allgemein einzuschätzen. Doch ziehen Sie den Spielraum dabei nicht zu eng. Das meint Ben Graham mit Sicherheitsmarge. Versuchen Sie nicht, ein Geschäft im Werte von 83 Millionen Dollar für 80 Millionen Dollar zu kaufen. Lassen Sie sich selbst eine genügend große Spanne. Wenn man eine Brücke baut, bestehen Sie auch darauf, dass diese 30.000 Pfund trägt, während Sie nur mit 10.000 Pfund schweren Lastwagen darüber fahren. Das gleiche Prinzip funktioniert auch bei der Kapitalanlage.
Nun mögen sich die mehr kommerziell denkenden unter Ihnen wundern, warum ich diesen Artikel schreibe. Denn viele zum Wertansatz Bekehrte werden notgedrungen die Spanne zwischen Preis und Wert verringern. Ich kann Ihnen aber versichern, dass dieses Geheimnis seit 50 Jahren offen liegt. Seit Ben Graham und Dave Dodd die Geheimnisse der Wertpapieranalyse geschrieben haben, habe ich in den 35 Jahren, in denen ich den Wertansatz praktiziere, keinen Trend zum wertorientierten Anlegen erkennen können. Anscheinend gibt es eine leicht perverse menschliche Eigenschaft, die Dinge gerne schwieriger macht als sie sind. Die akademische Welt hat sich, wenn überhaupt, in den letzten 30 Jahren von der Lehre des wertorientierten Anlegens tatsächlich entfernt. Und mir scheint, dass der Trend eher in diese Richtung geht. Schiffe segeln rund um die Welt, aber die „Flat Earth Society“ floriert weiter. Große Unterschiede zwischen Preis und Wert wird es im Marktgeschehen immer geben und diejenigen, die ihren Graham & Dodd gelesen haben, werden weiterhin erfolgreich sein.